Now many of the people who have just started their career into performance engineering ask me about the process of analyzing the oracle AWR reports. It is a fact that you can go to a dba and ask for this analysis , however being a performance engineer you should be able to understand the basics-content of AWR report and get some useful analysis info from the same
AWR/Staspack is a kind of profiling in Oracle database in order to identify the performance bottlenecks. AWR/Statspack is a report of performance related database statistics for given snapshots (period of time). It is a useful tool for Performance engineering to know Oracle database bottlenecks under load conditions. By default Oracle generates AWR snapshots for every one hour. Database Administrator can change the frequency of snapshot generation. AWR snapshots can be generated for the desired time by running the procedures in the database.
AWR report generates the performance statistics related to database server like system and session statistics, segment usage statistics, resource intensive SQLs, time model statistics and buffer cache details.
The important sections in the report are given below. For better understanding a snap from AWR for each section is provided here.
Elapsed time is the difference between begin snap time and end snap time. This time should be equal to the time for which the load test is performed for desired load. If DB time is less than elapsed time, it can be concluded that the bottleneck is not there in the database, else further analysis is required to ascertain the database performance bottleneck.

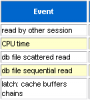
2. Top 5 timed events
This section can be interpreted as top 5 bottlenecks in database. All other sections in the report will provide breakup of these 5 timed events in to different metrics such as SQL Statistics, IO Statistics, Buffer Pool Statistics and Segment Statistics etc. Most of the database performance bottlenecks should get resolved if these top 5 events are eliminated or reduced.

3. SQL Statistics
This section provides the details of the SQL queries that are executed in the database during the test performed under load. Generally primary concern from Performance point of view for the application is the response times of the transactions at the peak load. This section address the issues related to response times of the database queries. Main points to look under this section are
SQL Ordered by Elapsed Time: Includes SQL statements that took significant execution time during processing.
SQL Ordered by CPU Time: Includes SQL statements that consumed significant database server CPU time during its processing. Examples of Server CPU time are Sorting, Hashing.
SQL Ordered by Gets: SQLs performed a high number of logical reads (from the cache) while retrieving data.
SQL Ordered by Reads: SQLs performed a high number of physical disk reads while retrieving data.
SQL Ordered by Parse Calls: These SQLs experienced a high number of parsing operations.
SQL Ordered by Executions: Lists the number of executions happened of each SQL.
4. Time Model Statistics
This section gives split up of time spent by the application in the processing of SQL queries like PL/SQL processing time, parsing, sequence load, sql execution etc.
AWR/Staspack is a kind of profiling in Oracle database in order to identify the performance bottlenecks. AWR/Statspack is a report of performance related database statistics for given snapshots (period of time). It is a useful tool for Performance engineering to know Oracle database bottlenecks under load conditions. By default Oracle generates AWR snapshots for every one hour. Database Administrator can change the frequency of snapshot generation. AWR snapshots can be generated for the desired time by running the procedures in the database.
AWR report generates the performance statistics related to database server like system and session statistics, segment usage statistics, resource intensive SQLs, time model statistics and buffer cache details.
The important sections in the report are given below. For better understanding a snap from AWR for each section is provided here.
- Elapsed Time
- Top 5 timed events
- SQL statistics
- Time Model Statistics
Elapsed time is the difference between begin snap time and end snap time. This time should be equal to the time for which the load test is performed for desired load. If DB time is less than elapsed time, it can be concluded that the bottleneck is not there in the database, else further analysis is required to ascertain the database performance bottleneck.
2. Top 5 timed events
This section can be interpreted as top 5 bottlenecks in database. All other sections in the report will provide breakup of these 5 timed events in to different metrics such as SQL Statistics, IO Statistics, Buffer Pool Statistics and Segment Statistics etc. Most of the database performance bottlenecks should get resolved if these top 5 events are eliminated or reduced.
3. SQL Statistics
This section provides the details of the SQL queries that are executed in the database during the test performed under load. Generally primary concern from Performance point of view for the application is the response times of the transactions at the peak load. This section address the issues related to response times of the database queries. Main points to look under this section are
SQL Ordered by Elapsed Time: Includes SQL statements that took significant execution time during processing.
SQL Ordered by CPU Time: Includes SQL statements that consumed significant database server CPU time during its processing. Examples of Server CPU time are Sorting, Hashing.
SQL Ordered by Gets: SQLs performed a high number of logical reads (from the cache) while retrieving data.
SQL Ordered by Reads: SQLs performed a high number of physical disk reads while retrieving data.
SQL Ordered by Parse Calls: These SQLs experienced a high number of parsing operations.
SQL Ordered by Executions: Lists the number of executions happened of each SQL.
4. Time Model Statistics
This section gives split up of time spent by the application in the processing of SQL queries like PL/SQL processing time, parsing, sequence load, sql execution etc.
- DB CPU: total CPU time consumed by database, apart from CPU background processes, in snapshot interval.
- sql execute elapsed time: Time spent by all SQL statements to execute
- DB time: Total time spent in DB, apart from time spent by background processes.